We dubbed last year’s Liv-ex Power 100 a ‘rebalancing act’. The Covid-19 pandemic and the buying spree it unleashed propelled the world’s great fine wine labels back to the top of their perch, from which some had been unseated in 2020.
Both the 2020 and 2021 rankings highlighted an important trend in the secondary market: greater diversity and the ongoing move away from Bordeaux. By contrast, this year’s Power 100 is more focused. One region in particular dominates the rankings – Burgundy. Supercharged by market confidence, ready money, and anticipation of a tiny 2021 release, Burgundy’s momentum was already building in last year’s Power 100 with big price performances and an increase in the number of wines ranked in the top 100. This year, Burgundy added six more entrants, for a total of 39; its highest-ever total and highest number since the last Burgundy surge in 2019.
| Region | 2017 | 2018 | 2019 | 2020 | 2021 | 2022 | Change |
|---|---|---|---|---|---|---|---|
| Burgundy | 24 | 29 | 34 | 24 | 33 | 39 | 6 |
| Bordeaux | 53 | 45 | 42 | 37 | 30 | 25 | -5 |
| Italy | 8 | 10 | 8 | 17 | 14 | 12 | -2 |
| Champagne | 6 | 7 | 7 | 7 | 8 | 9 | 1 |
| US | 3 | 3 | 3 | 5 | 6 | 8 | 2 |
| Rhone | 3 | 4 | 4 | 5 | 4 | 5 | 1 |
| Spain | 1 | 1 | 1 | 2 | 1 | 1 | 0 |
| Australia | 2 | 1 | 1 | 2 | 2 | 1 | -1 |
| Argentina | 0 | 0 | 0 | 0 | 0 | 0 | 0 |
| Chile | 0 | 0 | 0 | 0 | 0 | 0 | 0 |
| Germany | 0 | 0 | 0 | 1 | 2 | 0 | -2 |
Source: Liv-ex
Champagne too saw its 2021 momentum spill over into 2022, as collectors sought value and portfolio diversity. Between them, Burgundy and Champagne siphoned off 9.0% of the total market share from other regions over the course of the year, largely at the expense of Bordeaux and Italy.
| Region | 2020-2021 | 2021-2022 |
|---|---|---|
| Bordeaux | 39.7% | 33,6% |
| Burgundy | 20.7% | 26.0% |
| Champagne | 8,4% | 12.1% |
| California | 7.6% | 6.9% |
| Tuscany | 8.8% | 6.8% |
| Piedmont | 6.3% | 5.1% |
| Rhone | 4.1% | 4.4% |
| Others | 4.4% | 5.1% |
Source: Liv-ex
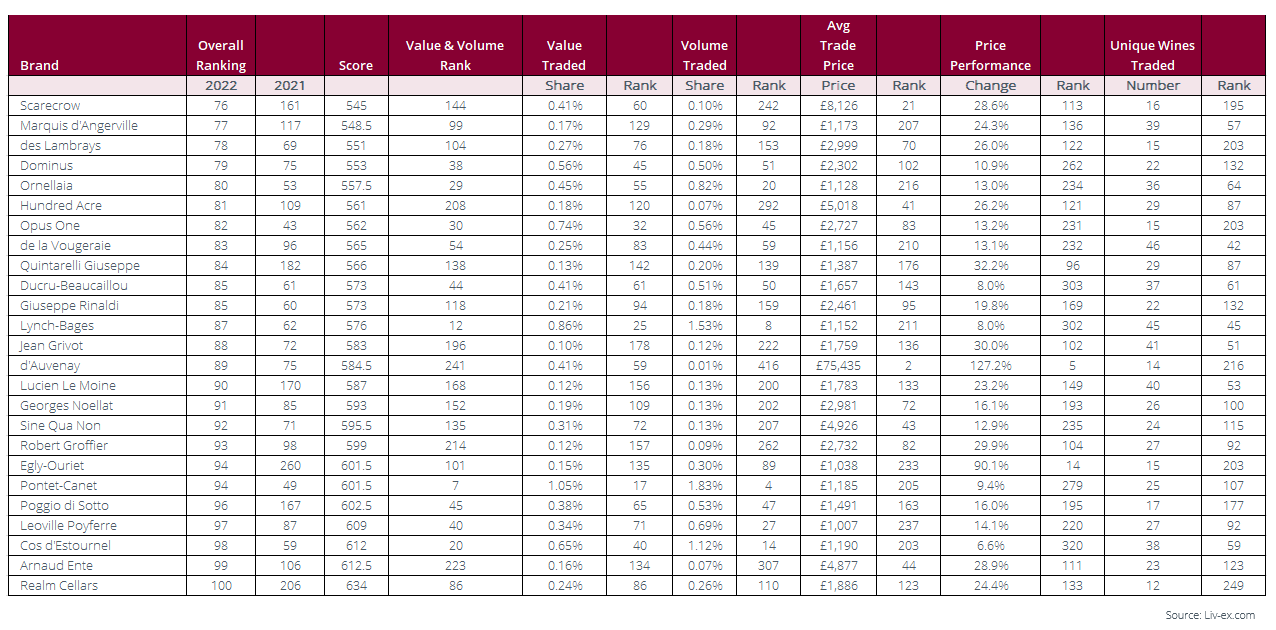
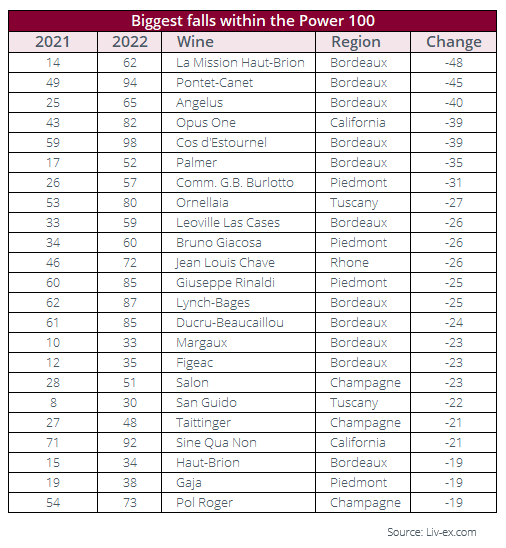
And with that in mind, both tables show (in part) why this year’s list looks the way it does, and why some of the previously high-flying Italian and Californian brands have slipped down the rankings – for this year at least. This is not to say that there has not been demand across other regions. Of the 422 wines that qualified for the Power 100 this year, fewer than 30 had a negative average price performance – and none in the top 100 itself.
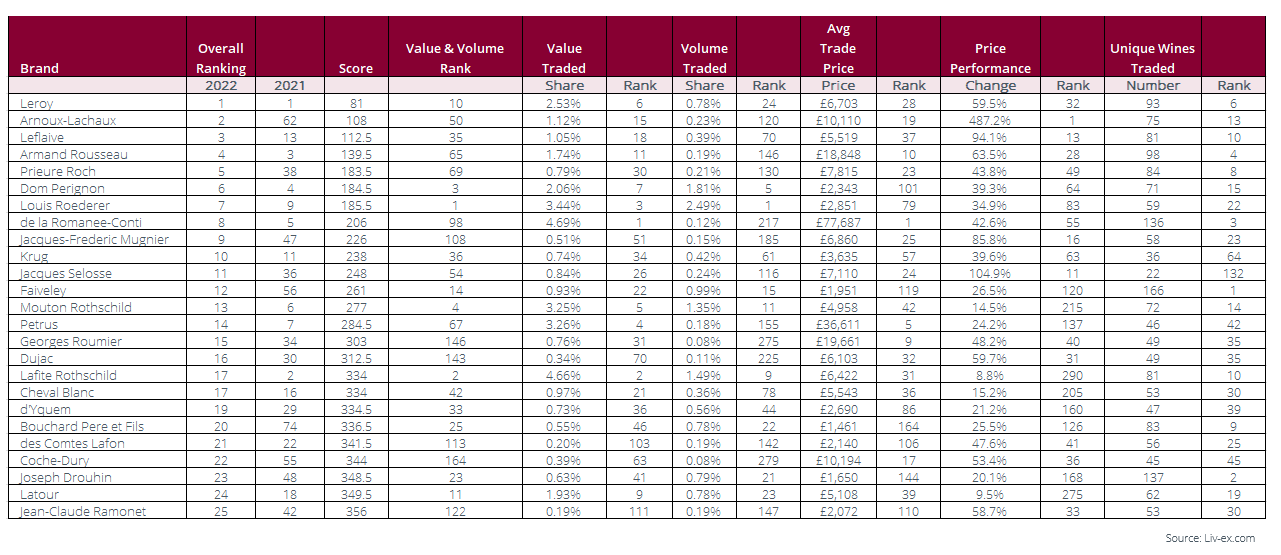
As always with the Power 100 there are some key factors to bear in mind. The data set analysed covers the year from 1st October 2021 to 30th September 2022. The rankings are based on several weighted criteria of which price performance, while important, is only one. As such, it is worth looking where each wine ranks according to each criteria, as well as the overall ranking.
For example, a Burgundian estate may rank highly for the number of its wines that traded, the cumulative value of that trade, average price per case and price performance, but its trade volume may be quite small. By contrast, a Bordeaux estate could rank highly for its trade value and volume but is likely to rank lower for the number of wines being sold and price performance. Looking at the rankings in detail allows for a more nuanced view. The full methodology for the Power 100 can be found at the end of this report.
For the first time ever, no Bordeaux wines feature in the top 10. Not a single First Growth from either bank.
This year they have been totally usurped by Burgundy and Champagne. Four Burgundies and one Champagne have risen to displace Château Lafite Rothschild (2nd last year), Château Mouton Rothschild (6th), Pétrus (7th), Sassicaia (8th) and Château Margaux (10th).
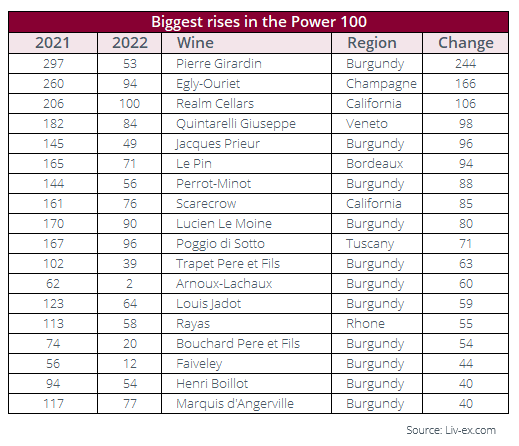
The biggest risers into the top 10 were Jacques-Frédéric Mugnier (rising 38 places), Prieuré Roch (33 places) and Domaine Arnoux-Lachaux (up 60 places). At the top for the third year in a row is Domaine Leroy. As our methodology explains, we combine maison and domain labels under one brand. For Leroy this is both a strength and a weakness. On the plus side, it significantly enlarges the pool of wines recorded as trading at what are high volumes for Burgundy. It also provides a major boost to the brand’s total trade value. On the other hand, the inclusion of the maison wines significantly dilutes the average trade price. Those who have ever looked at the cost of a grand cru from Domaine Leroy recently will know that they are not bought at £6,700 per dozen anymore – or even in packs that large either.
However, it demonstrates the continued power of Leroy. Such is the clamour to taste these wines yet so limited is supply that eager buyers are seeking out the closest thing to it. And it keeps the prices rising. In the 2020 Power 100 Leroy’s average price performance was 8.6%. Last year it was 39.0% and this year it was a staggering 59.5%. The other estate associated with Leroy (but treated separately) is Domaine d’Auvernay. Although not in the top 10 (it slipped down the rankings this year due to low trade figures), it saw average price increases of 127.2% and had the second-highest average trade price behind Domaine de la Romanée-Conti.
This fever around the most sought-after Burgundies continues to disenfranchise all but the wealthiest collectors who, in turn, continue to drive the expansion of the category, as we shall now examine.
| Rank | Wine | Region | Average Market Price change | |
|---|---|---|---|---|
| 1 | Arnoux-Lachaux | Burgundy | 487,2% | |
| 2 | d'Auvenay | Burgundy | 127,2% | |
| 3 | Jacques Selosse | Champagne | 104,9% | |
| 4 | Leflaive | Burgundy | 94,1% | |
| 5 | Egly-Ouriet | Champagne | 90,1% | |
| 6 | Jacques-Frederic Mugnier | Burgundy | 85,8% | |
| 7 | Pierre-Yves Colin-Morey | Burgundy | 84,1% | |
| 8 | Francois Raveneau | Burgundy | 71,0% | |
| 9 | Sylvain Cathiard | Burgundy | 66,5% | |
| 10 | Salon | Champagne | 64,2% |
Source: Liv-ex
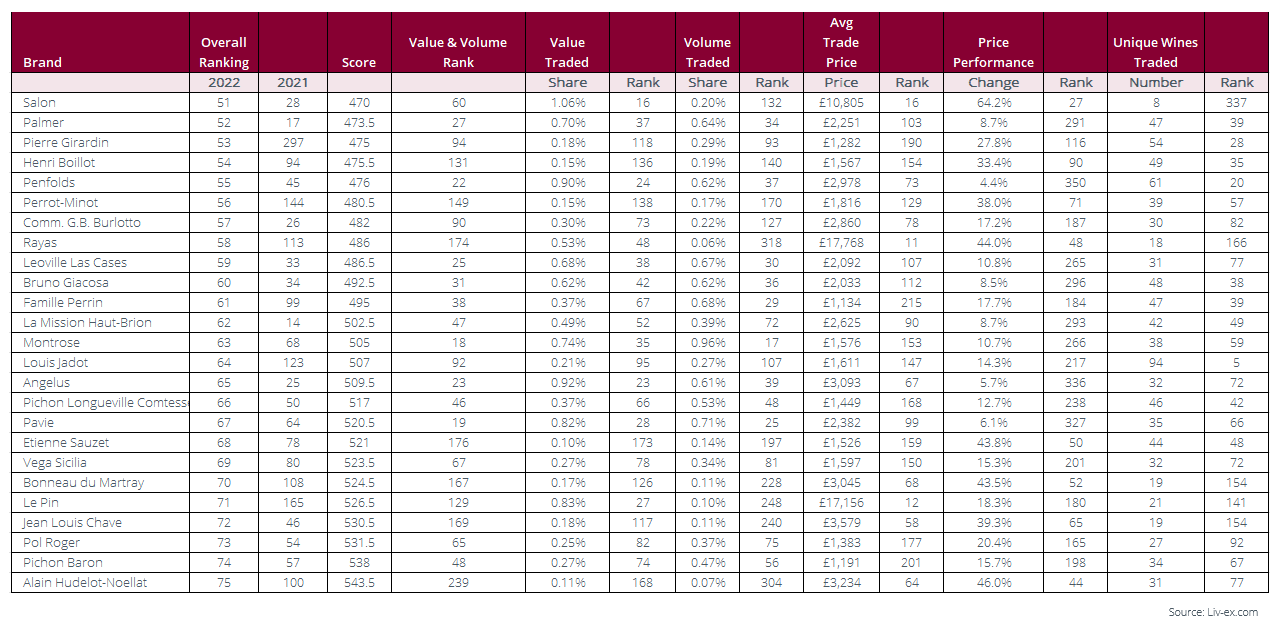
The Power 100 is a snapshot of the ever-changing landscape of the secondary market. This year’s list caught Burgundy at the very height of its latest upswing. Yet, already, the direction of the market in 2022 suggests change is on the way. Just as we saw in 2019, Burgundy’s latest surge may be dizzying but could be swiftly stymied by a lack of supply and an increasing reluctance to pay such steep prices for handfuls of bottles. The higher it flies, the thinner the air, and the fewer buyers there are. Furthermore, as 2022 has gone on, the monthly performance of the Burgundy 150 index has sputtered. It ran flat in June and August, rose 1.8% in September, and rose 0.7% in October – in each of those last two months it recorded its smallest monthly gains since August 2021.
| Rank | Wine | Region | Unique number of LWIN11s traded |
|---|---|---|---|
| 1 | Faiveley | Burgundy | 166 |
| 2 | Joseph Drouhin | Burgundy | 137 |
| 3 | Romanee-Conti | Burgundy | 136 |
| 4 | Armand Rousseau | Burgundy | 98 |
| 5 | Louis Jadot | Burgundy | 94 |
| 6 | Leroy | Burgundy | 93 |
| 7 | M. Chapoutier | Rhone | 88 |
| 8 | Prieure Roch | Burgundy | 84 |
| 9 | Bouchard Pere et Fils | Burgundy | 83 |
| 10 | Leflaive | Burgundy | 81 |
Source: Liv-ex
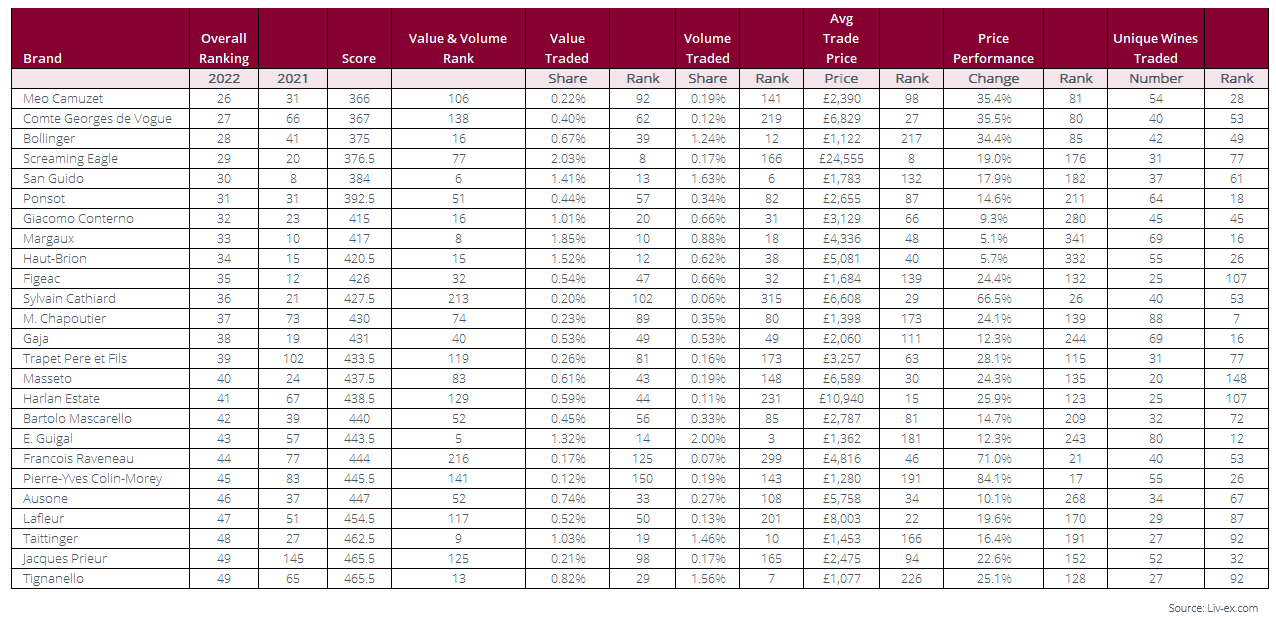
The clear momentum is now with Champagne. Cristal and Dom Pérignon have been at the forefront of trade throughout the year. The Champagne 50 is the best performing Liv-ex Fine Wine 1000 index over one year and is quickly closing in on the Burgundy 150 as the best-performer year-to-date. In truth, the market has moved in a positive direction. As mentioned previously, all the brands in the top 100 saw their prices rise. But market headwinds are strong and further price rises may not be as easy to come by. After some record years as the market expanded, the rate of growth, measured by number of wines trading and qualifying for the Power 100, was not as great this year as it was last year.
Between 1st October 2021 and 30th September 2022 exactly 12.332 wines were traded from 1.694 producers, respective increases of 4,2% and 1,6% on the same period a year earlier. The number of wines qualifying for inclusion was 422, a rise of just 0,3%. Overall, the market continues to bring in new wines from across the world – Kumeu River from New Zealand, Chacra in Argentina, and Spain’s Telmo Rodriguez were among the new qualifiers this year – and the market remains broader and more balanced than it was a decade ago.
Nonetheless, looking forward to next year’s Power 100, it is hard to shake the feeling that things are going to look quite different once again.
This article was originally published on Liv-ex, the global marketplace for the wine trade. Data within it reflects the independent, real-time buying and selling activity between hundreds of the world's most active and most reputable wine businesses. Discover the smartest way to price, buy and sell wine!
© Header Photo: Wikipedia - Sarah Stierc